05
Diagnostics
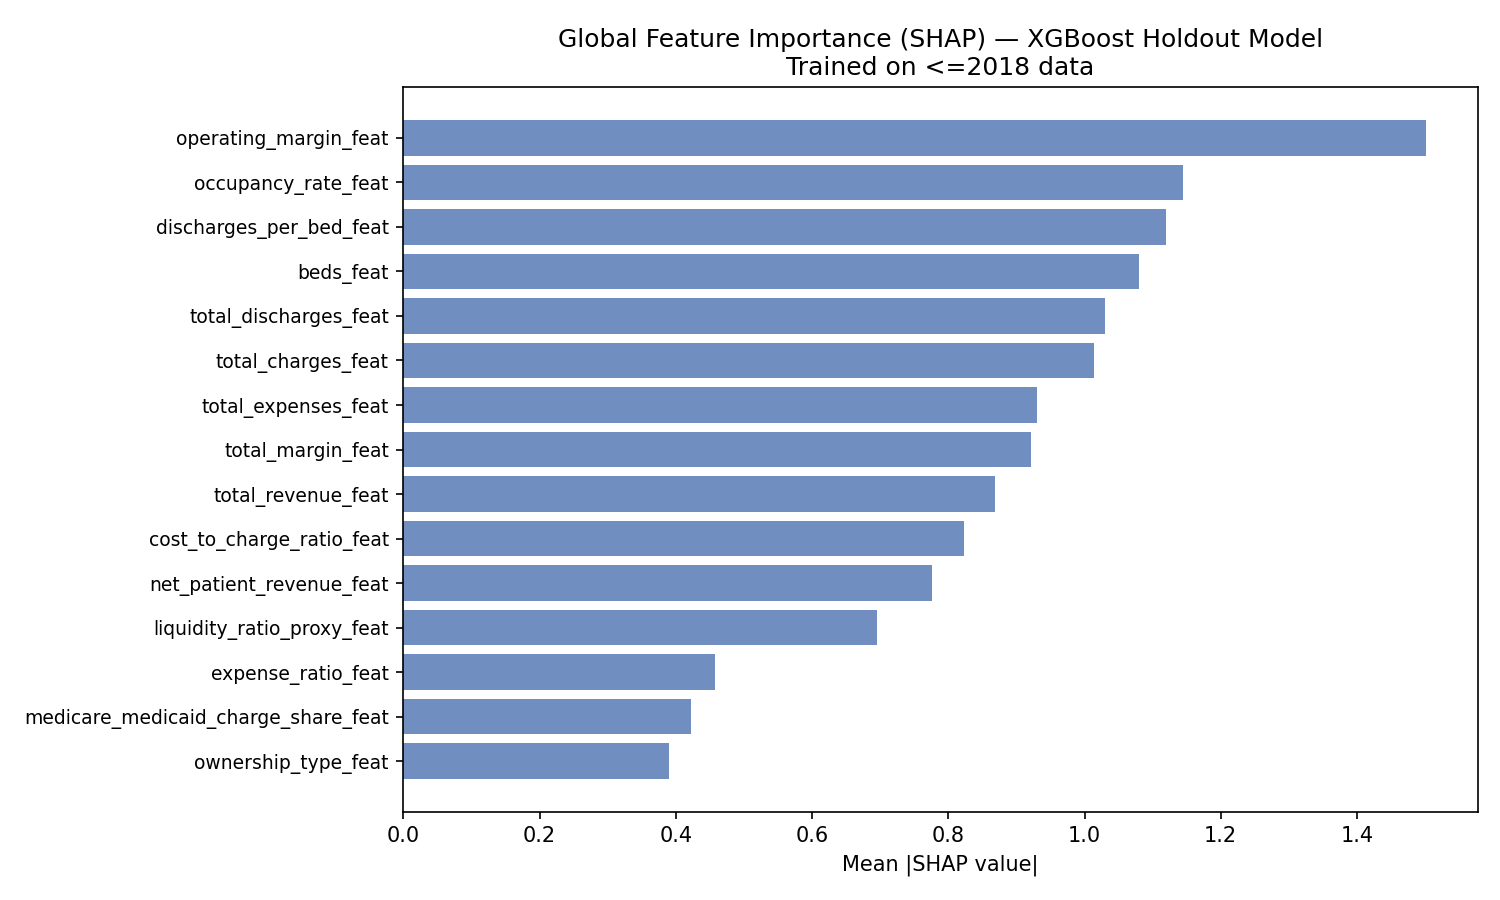
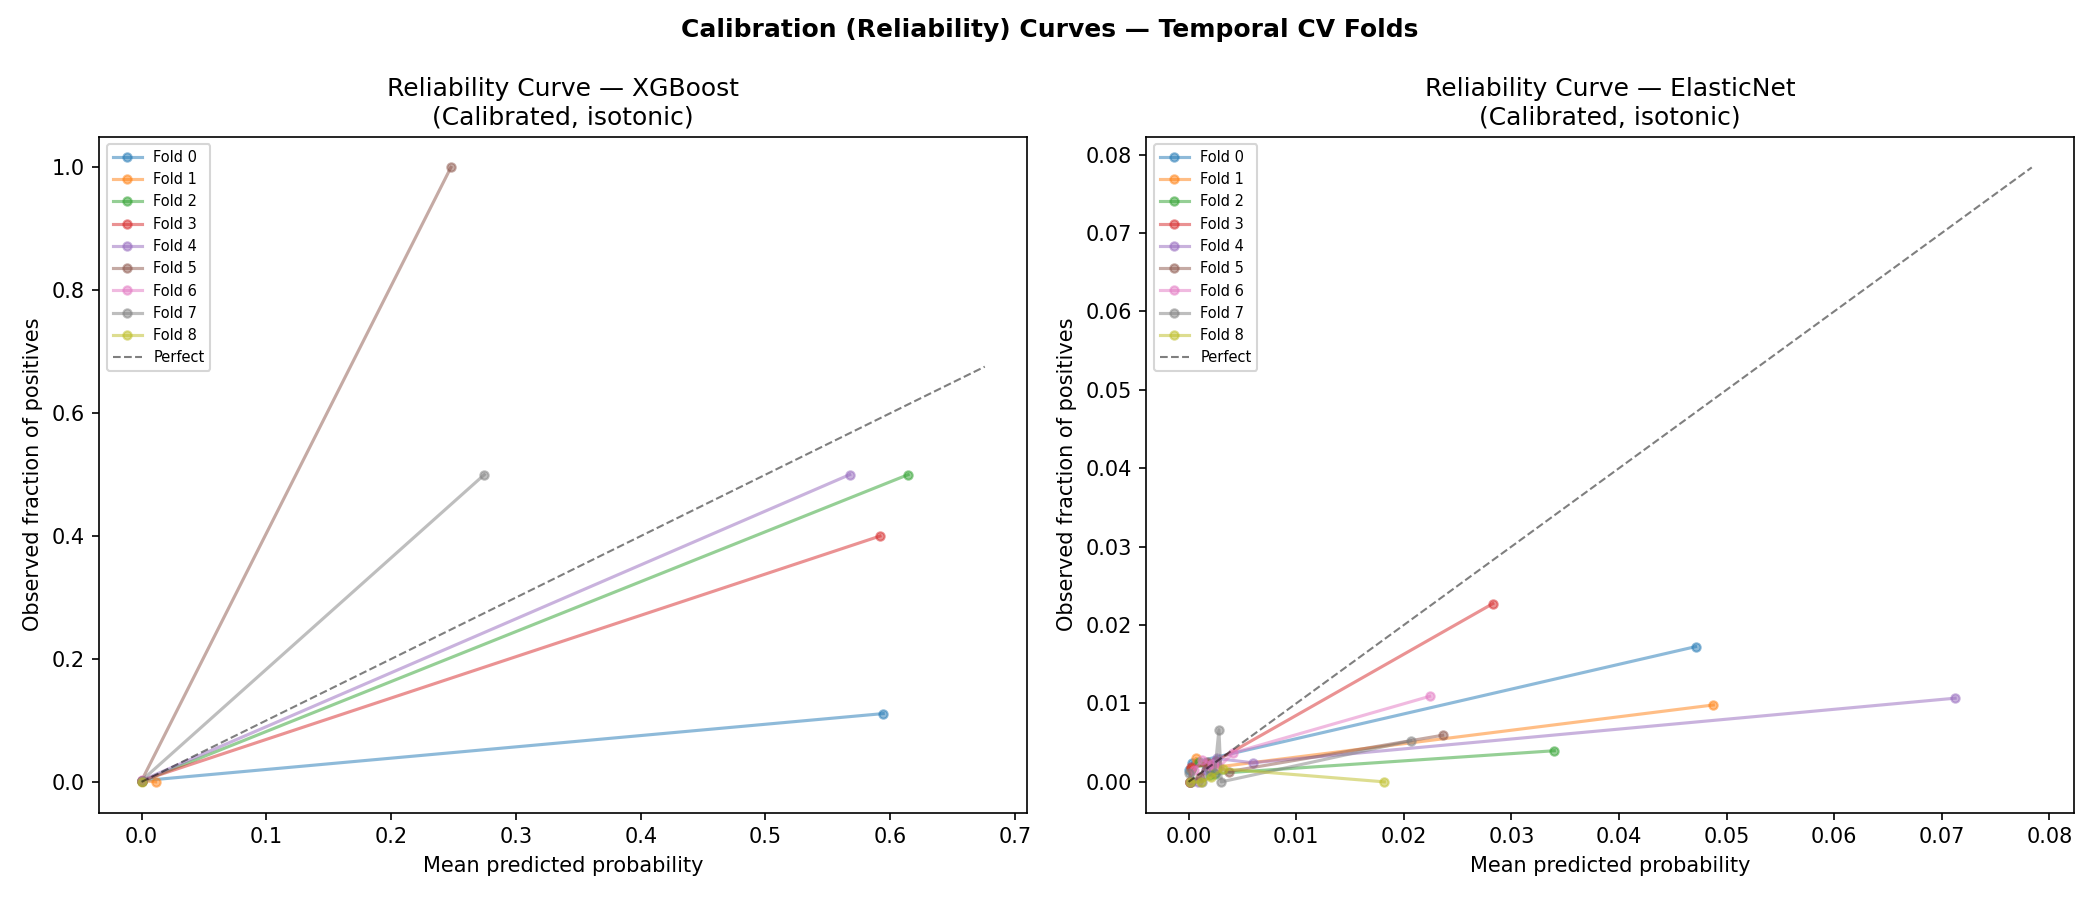
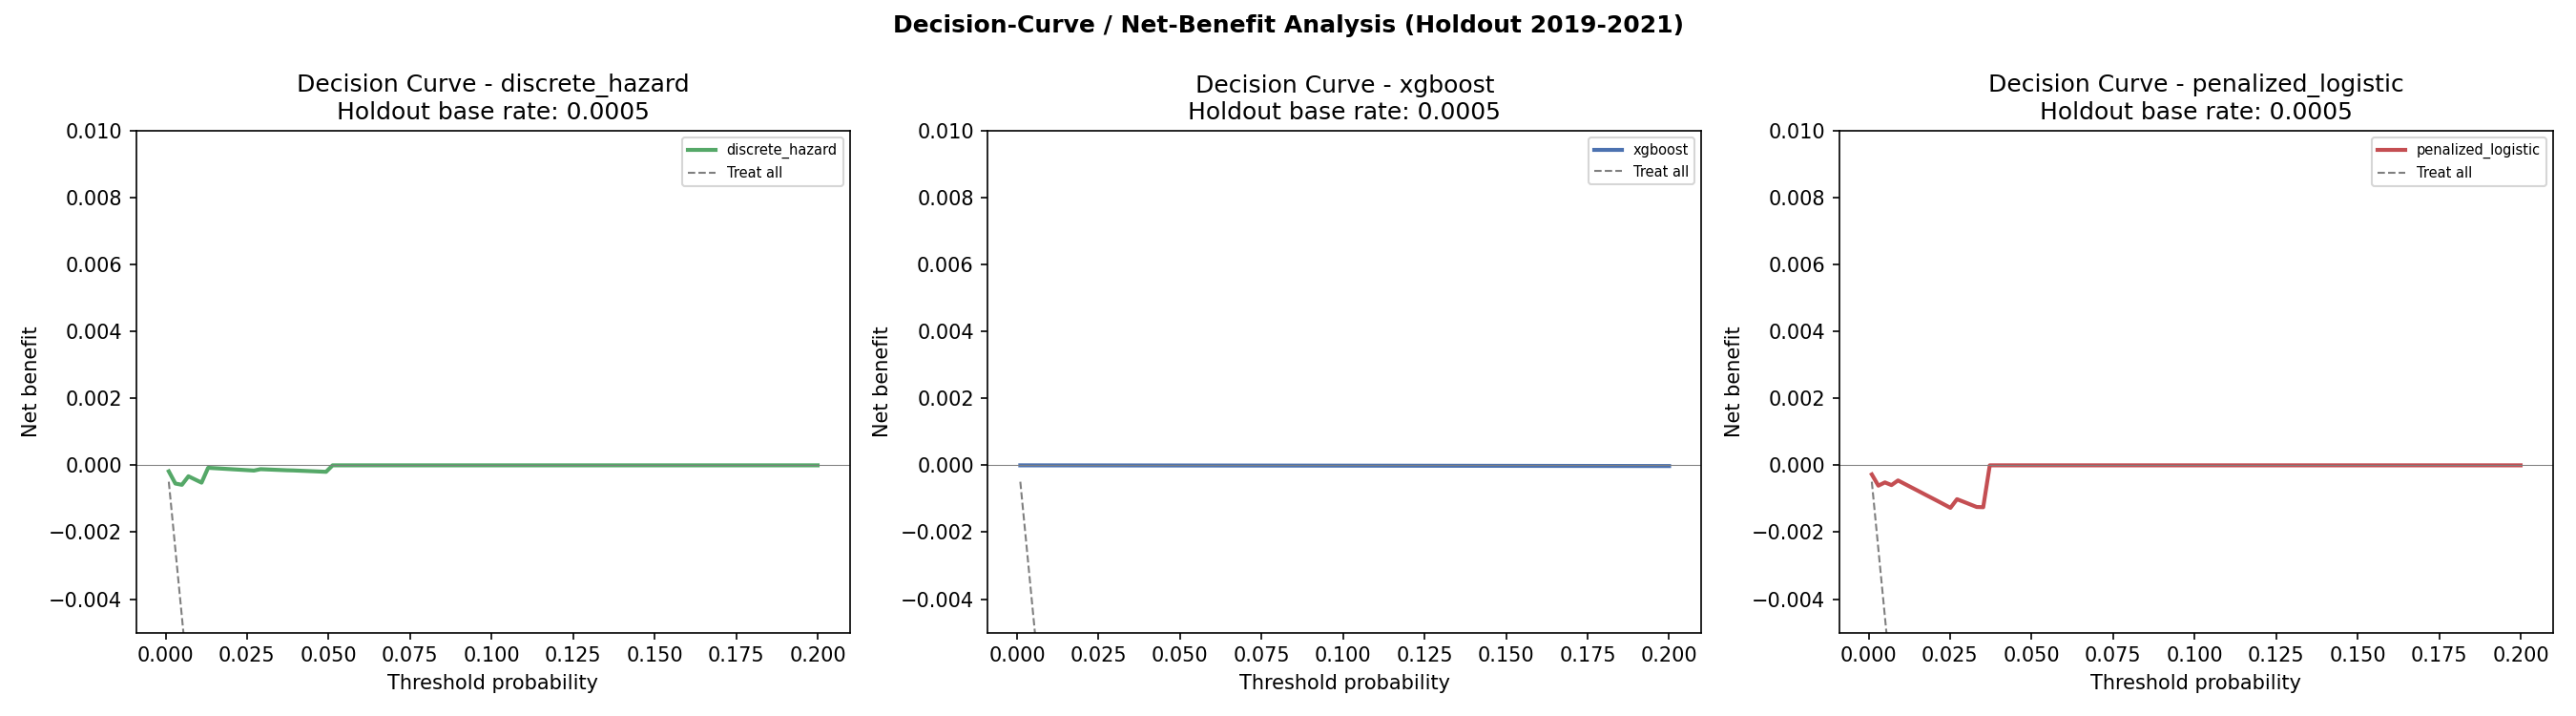
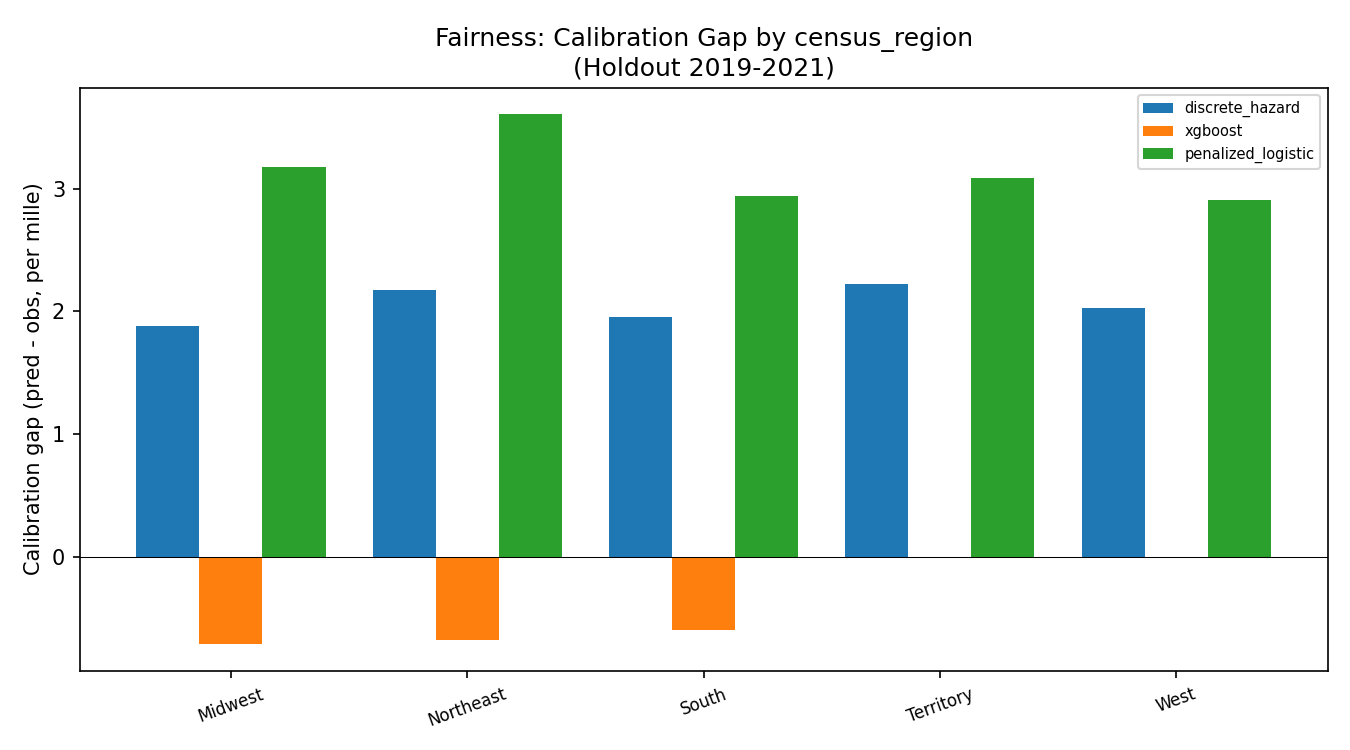
Interpretability, calibration, net benefit, and fairness slices.
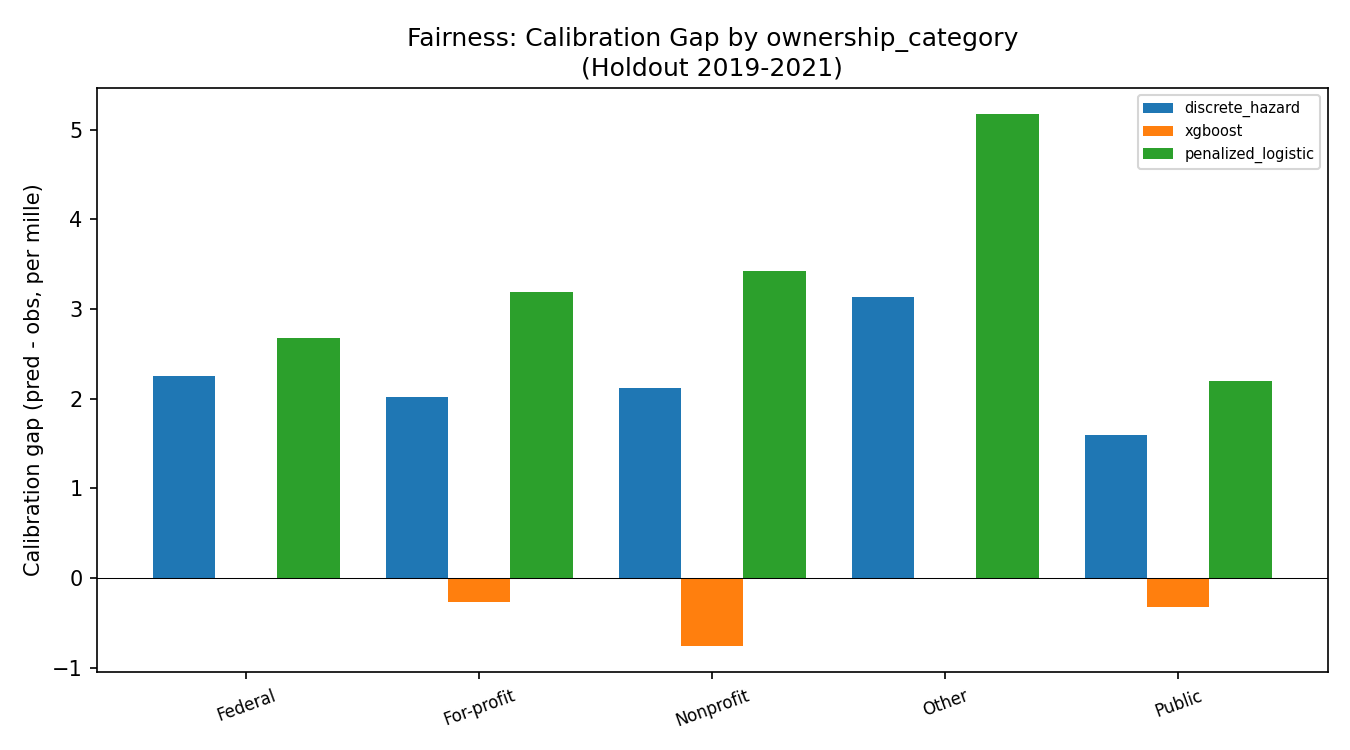
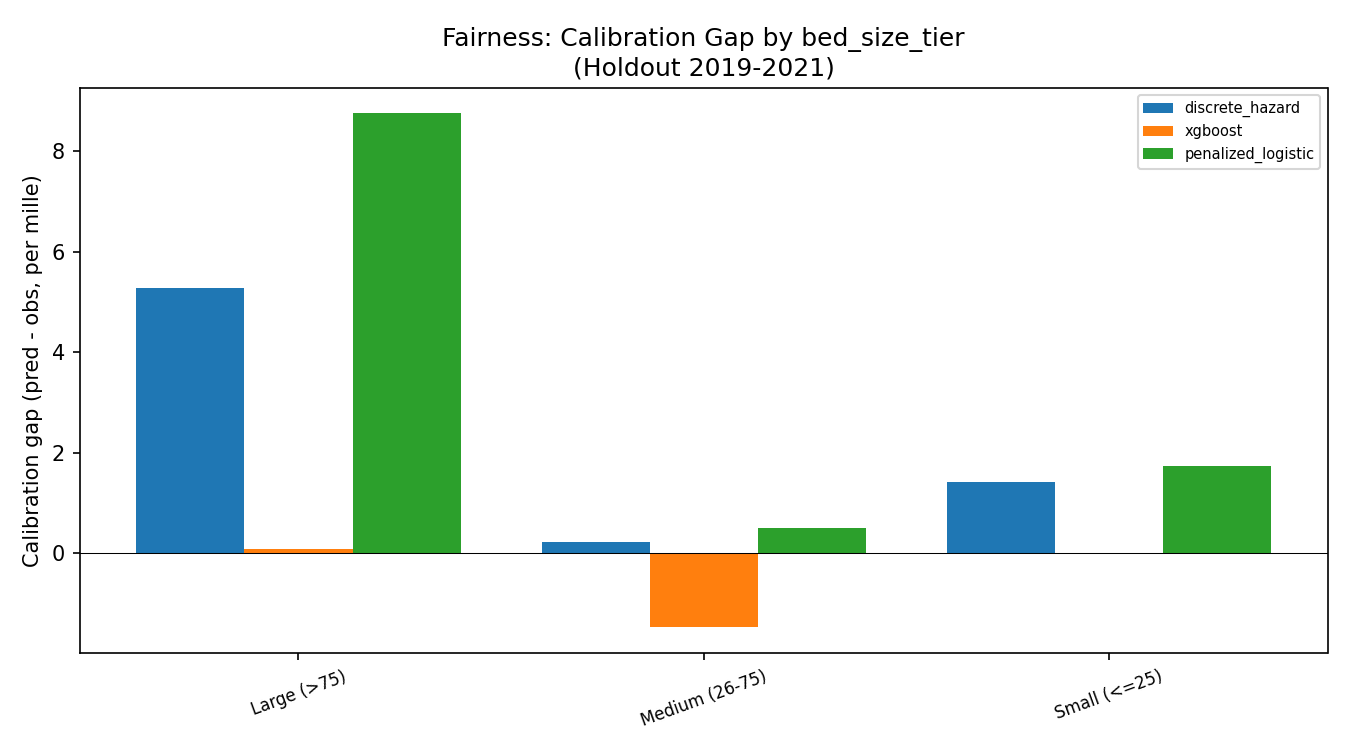
Held-out evaluation · Phase 5
Predicting 1-to-2-year-ahead closure or conversion for U.S. rural hospitals from public CMS cost-report financials. This page reports the one-time evaluation on the 2019–2021 hold-out, a window the models never saw during development.
Checked before anything else, because a broken calibrator silently invalidates every number below it.
Degenerate calibration detected
XGBoost produced a calibration map that collapsed the model's ranking.
A near-constant predictor scores AUROC 0.5000 by construction, so the hold-out
metrics for the affected models below measure the calibrator, not the model.
This page was generated from artifacts that still carry the defect —
re-run python run.py train evaluate and regenerate. The banner is the guard in
tests/test_calibration.py doing its job, not a rendering error.
| Model | Distinct values | Rank corr. vs raw | Share at mode | Verdict |
|---|---|---|---|---|
| XGBoost | 2 | 0.016 | 100.0% | collapsed |
| L2-penalized logistic | 27 | 0.995 | 15.3% | preserved |
| Discrete-time hazard | 17 | 0.988 | 25.0% | preserved |
PR-AUC is the primary metric. At this base rate AUROC flatters a model that ranks a handful of positives well while flagging thousands of negatives.
| Model | CV PR-AUC | Hold-out PR-AUC | AUROC | Brier | Lift over base |
|---|---|---|---|---|---|
| Discrete-time hazard (survival) | 0.0218 | 0.0011 | 0.6833 | 0.000530 | 2.2× |
| XGBoost (gradient-boosted trees) | 0.1313 | 0.0005 | 0.5000 | 0.000516 | 1.0× |
| L2-penalized logistic | 0.0365 | 0.0009 | 0.7050 | 0.000569 | 1.8× |
An AUROC of exactly 0.5000 is highlighted. It is not a result — it is what a constant predictor returns, and it means the calibration audit above should be read first.
The question a summary metric cannot answer: of the 6 hospitals that actually closed, how near the top of the list did the model put them?
| CCN | Year | Region | Rank | Percentile |
|---|---|---|---|---|
| 140143 | 2021 | Midwest | 2 of 11,760 | 100.0 |
| 160008 | 2020 | Midwest | 2 of 11,760 | 100.0 |
| 170074 | 2019 | Midwest | 2 of 11,760 | 100.0 |
| 340133 | 2021 | South | 2 of 11,760 | 100.0 |
| 390071 | 2021 | Northeast | 2 of 11,760 | 100.0 |
| 490098 | 2019 | South | 2 of 11,760 | 100.0 |
| CCN | Year | Region | Rank | Percentile |
|---|---|---|---|---|
| 340133 | 2021 | South | 1,433 of 11,760 | 87.8 |
| 390071 | 2021 | Northeast | 1,433 of 11,760 | 87.8 |
| 490098 | 2019 | South | 3,117 of 11,760 | 73.5 |
| 170074 | 2019 | Midwest | 3,117 of 11,760 | 73.5 |
| 140143 | 2021 | Midwest | 3,667 of 11,760 | 68.8 |
| 160008 | 2020 | Midwest | 4,787 of 11,760 | 59.3 |
| CCN | Year | Region | Rank | Percentile |
|---|---|---|---|---|
| 140143 | 2021 | Midwest | 2,120 of 11,760 | 82.0 |
| 170074 | 2019 | Midwest | 2,120 of 11,760 | 82.0 |
| 340133 | 2021 | South | 2,120 of 11,760 | 82.0 |
| 390071 | 2021 | Northeast | 2,120 of 11,760 | 82.0 |
| 490098 | 2019 | South | 2,120 of 11,760 | 82.0 |
| 160008 | 2020 | Midwest | 5,172 of 11,760 | 56.0 |
Ranks, not scores. A calibrated probability of 0.4% sounds like nothing until you note the base rate is 0.051%.
40 bins, counts on a log scale so a single spike does not flatten the rest of the shape.
Interpretability, calibration, net benefit, and fairness slices.
Sample size. 6 positive events in 11,760 rows. Every point estimate here carries wide uncertainty and none should be quoted without that qualifier.
Policy shock. The hold-out overlaps the pandemic. CARES Act and Provider Relief Fund transfers altered hospital finances in ways no pre-2019 training data encodes.
Screening, not prediction. Scores rank hospital-years by relative risk. They are not probabilities anyone should act on, and the model card lists the out-of-scope uses explicitly.
Historical, not current. All scores cover 1997–2021 and are published for reproducibility. They say nothing about any hospital's condition today.
Identifiers. Keyed by CMS Certification Number, a public identifier. Every input is public CMS data — HCRIS cost reports and the UNC Sheps Center closure list. No PII beyond public records.
Generated by python run.py dashboard
(src/scoring/dashboard.py) from the artifacts in
reports/modeling/. No JavaScript and no tracking. The only external
request is a webfont from Google Fonts; the page renders correctly in a system
serif without it.