Model Performance
We establish a logistic-regression baseline before reaching for gradient boosting, so the complex model has to earn its place.
Validation strategy
A stratified 80/20 train/test split is held out up front; hyperparameters are tuned with stratified 3-fold cross-validation inside the training split. All metrics below are on the held-out test split.
Performance Metrics
Real KKBox data, held-out test split (20%) of a fixed-seed 50,000-user labeled sample (43,999 with features, churn rate 8.9%, cutoff 2017-03-01). Written to
reports/metrics.jsonon every run. A 50K sample is used for memory reasons;make data && make trainruns the same pipeline on synthetic data for a no-download check.
| Metric | LR | XGB | XGB-cal |
|---|---|---|---|
| ROC-AUC | 0.748 | 0.783 | 0.788 |
| PR-AUC | 0.265 | 0.412 | 0.416 |
| LogLoss | 0.601 | 0.390 | 0.243 |
| Brier | 0.198 | 0.123 | 0.067 |
LR = logistic-regression baseline · XGB = tuned XGBoost · XGB-cal = calibrated (shipped).
XGBoost beats the baseline on every metric; the gap is largest on PR-AUC (+56%), the metric that matters under class imbalance.
Probability calibration
Because the ROI simulator multiplies probabilities by lifetime
value, they must be calibrated, not merely well-ranked. Platt scaling
(CalibratedClassifierCV) cut Brier 0.123 → 0.067 and LogLoss 0.390 → 0.243
on the test split while leaving ROC-AUC unchanged — exactly what calibration should do.
Interpretability
We use SHAP (SHapley Additive exPlanations) so the model is not a black box.
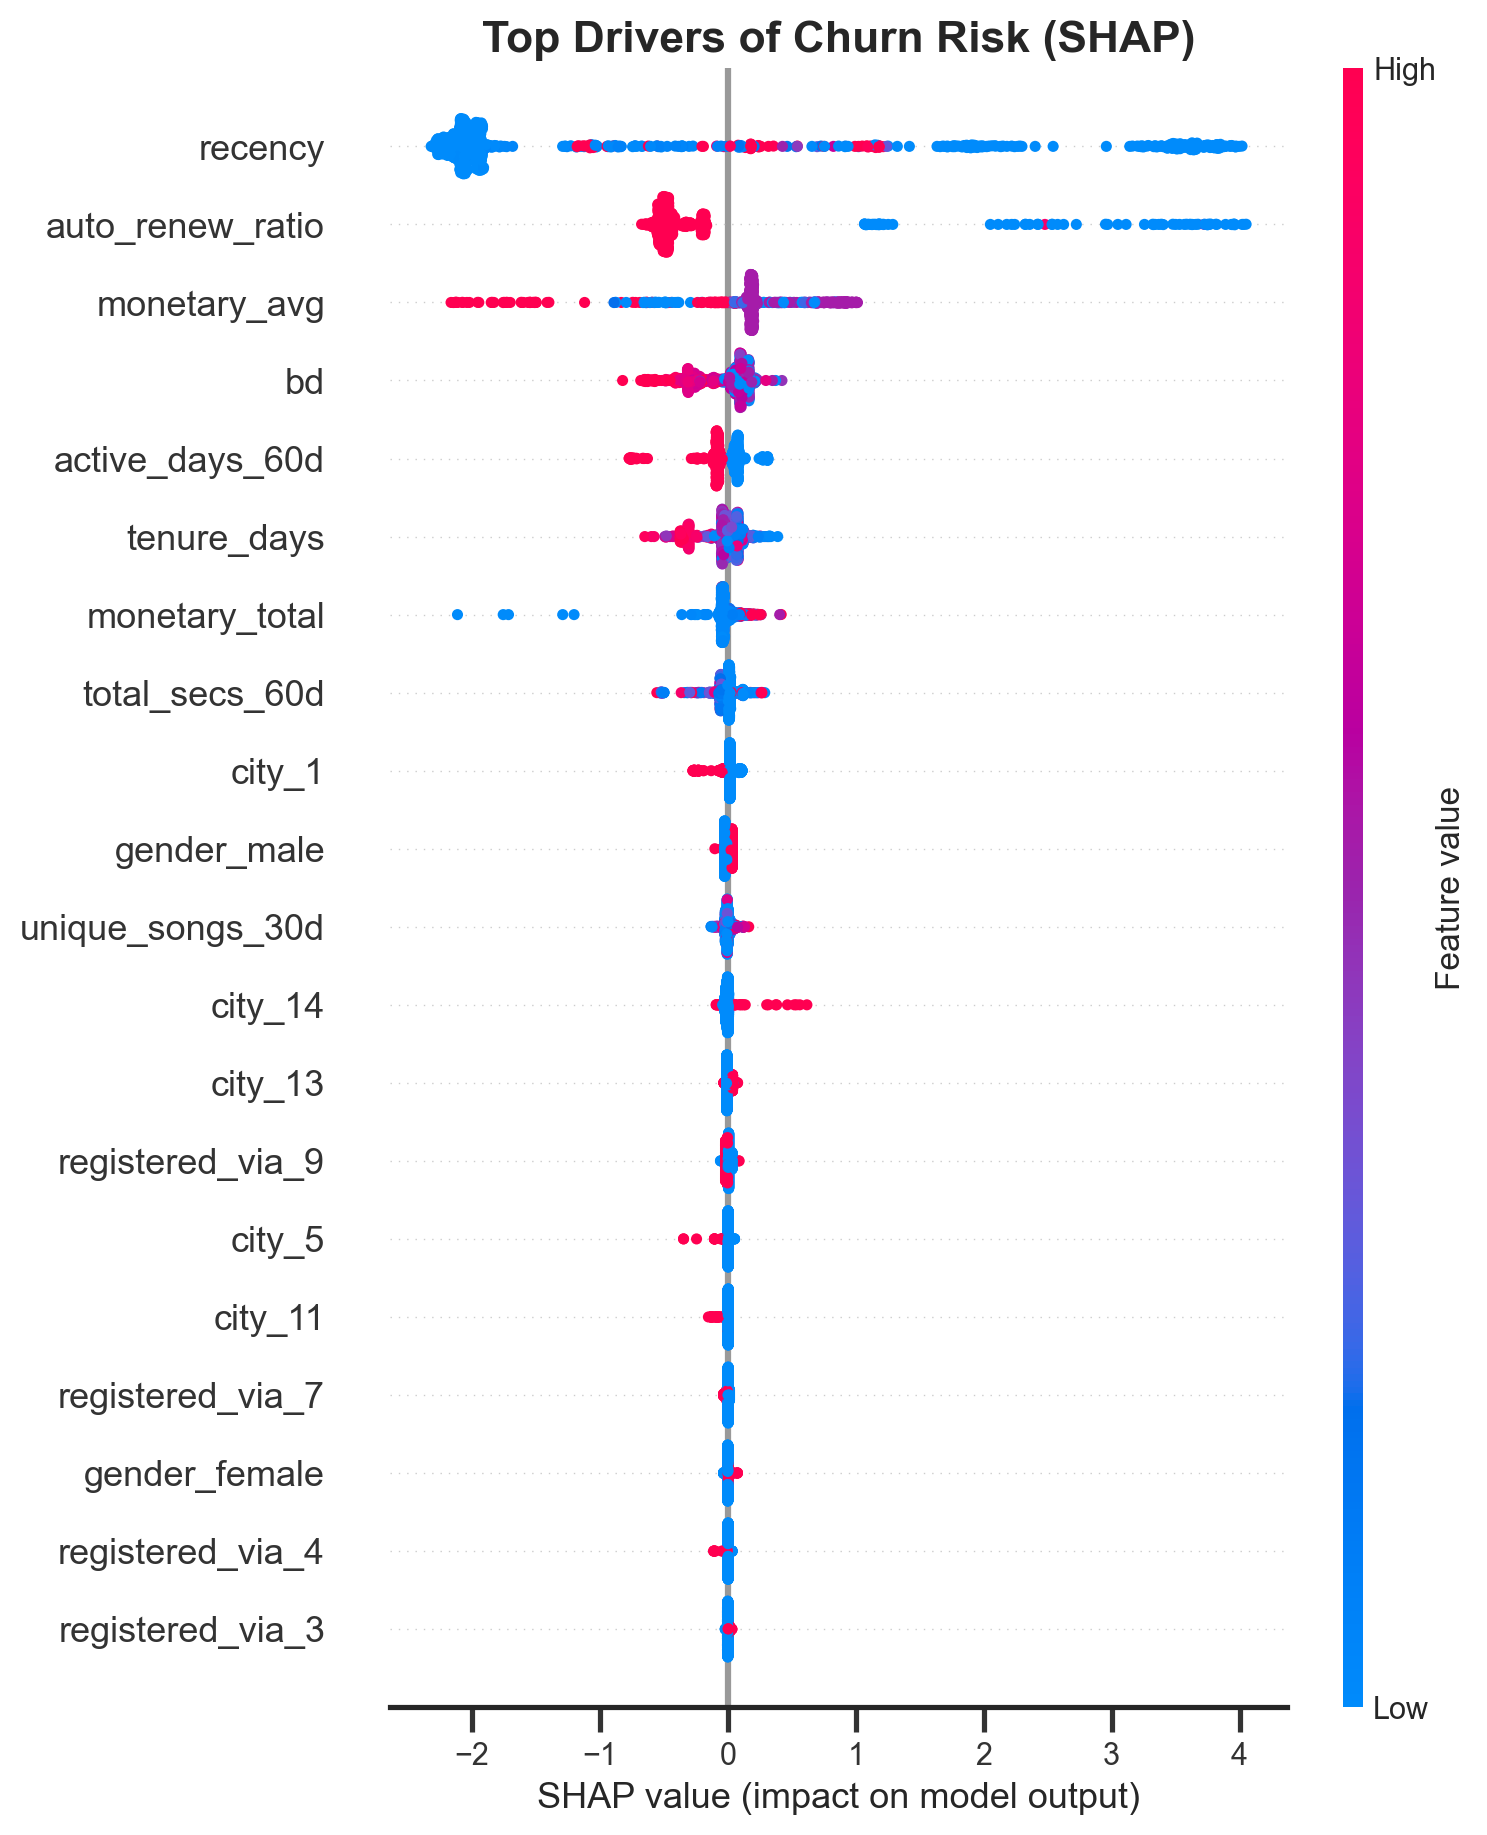
The model consumes engineered RFM and engagement features — recency, frequency,
monetary_total, auto_renew_ratio, total_secs_60d, secs_trend, and
tenure_days. Recency and auto-renew behavior are typically the strongest churn
signals; see the plot above for the ranking on the current run.
Confusion Matrix
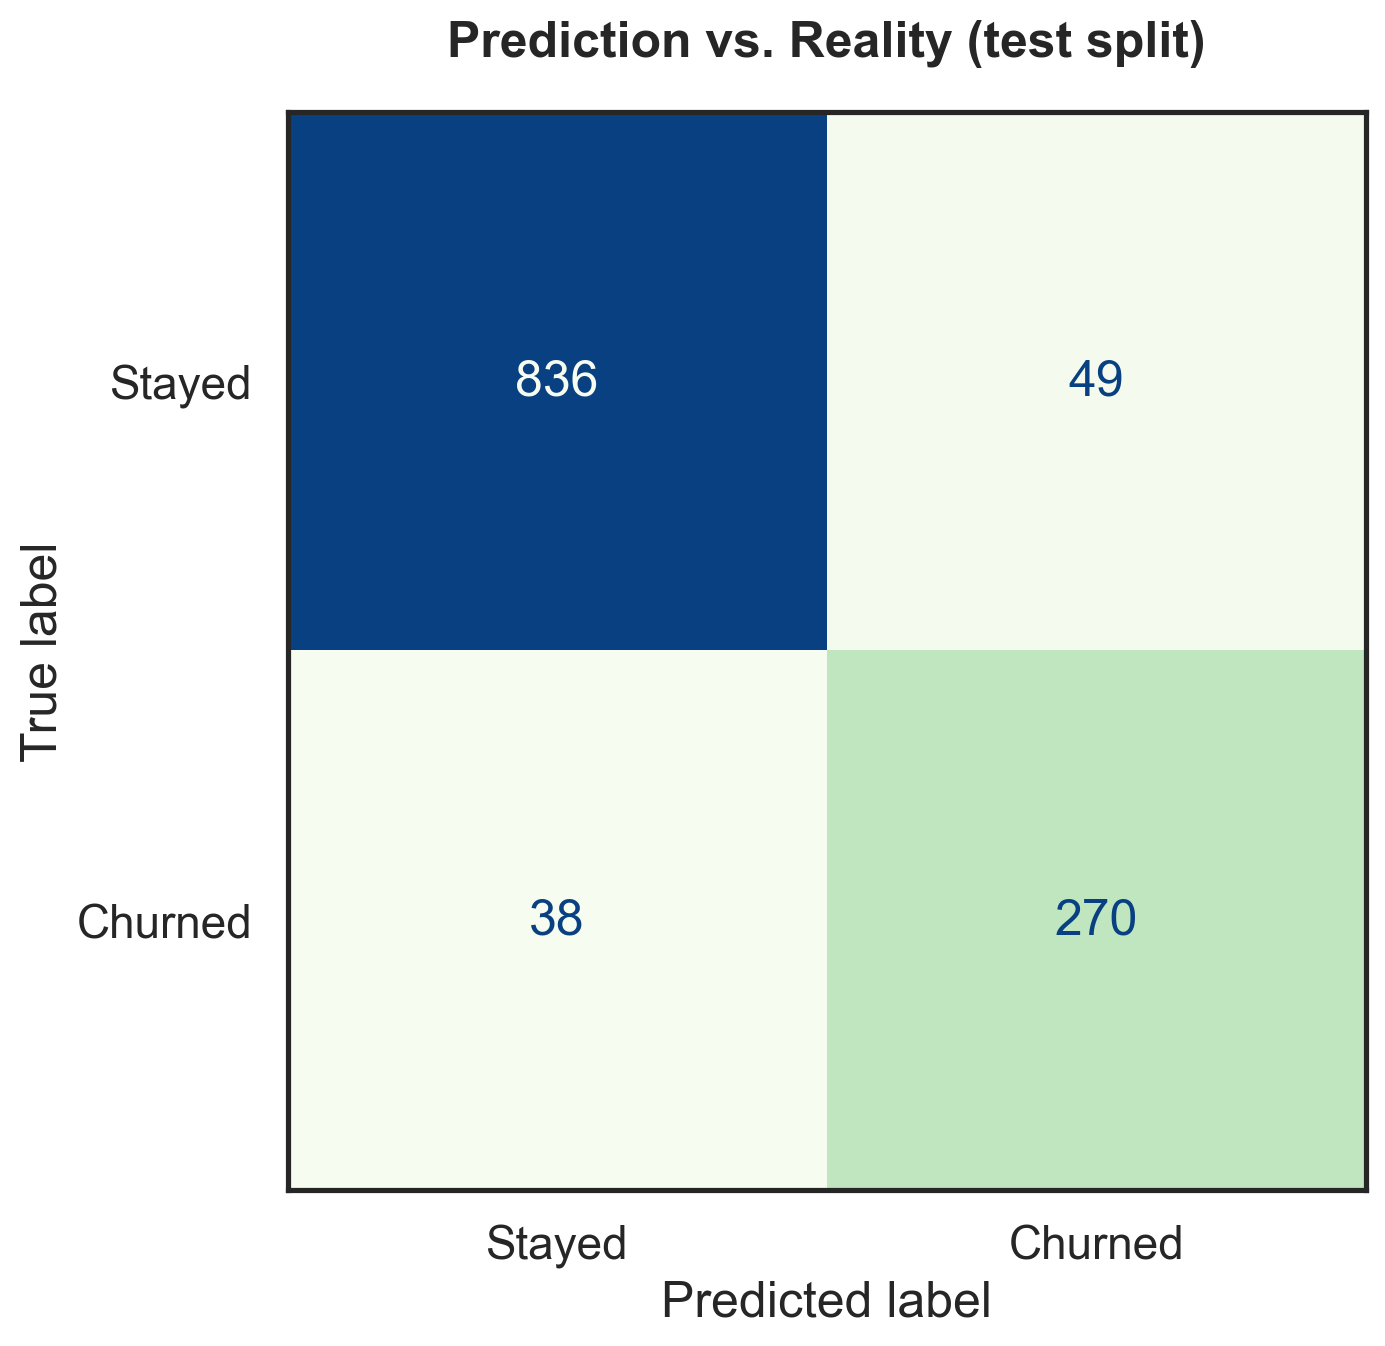
Thresholding the predicted probability at 0.5 on the held-out test split: